/**
* Copyright yoshida_surf ( http://wonderfl.net/user/yoshida_surf )
* MIT License ( http://www.opensource.org/licenses/mit-license.php )
* Downloaded from: http://wonderfl.net/c/aloj
*/
<?xml version="1.0" encoding="utf-8"?>
<s:Application xmlns:fx="http://ns.adobe.com/mxml/2009"
xmlns:s="library://ns.adobe.com/flex/spark"
xmlns:mx="library://ns.adobe.com/flex/mx"
creationComplete="init()">
<fx:Script>
<![CDATA[
import mx.collections.ArrayCollection;
[Bindable]
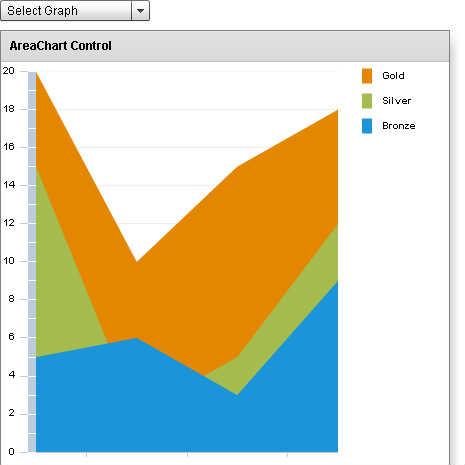
private var _dataAC:ArrayCollection = new ArrayCollection([
{Country:"JPN", Gold:20, Silver:15, Bronze:5},
{Country:"USA", Gold:10, Silver:2, Bronze:6},
{Country:"FRA", Gold:15, Silver:5, Bronze:3},
{Country:"GER", Gold:18, Silver:12, Bronze:9}
]);
[Bindable]
private var _data2AC:ArrayCollection = new ArrayCollection([
{Date:"25-Jul", Open:40.75, High:40.75, Low:40.24, Close:40.31},
{Date:"26-Jul", Open:39.98, High:40.78, Low:39.97, Close:40.34},
{Date:"27-Jul", Open:40.38, High:40.66, Low:40, Close:40.63},
{Date:"28-Jul", Open:40.49, High:40.99, Low:40.3, Close:40.98},
{Date:"29-Jul", Open:40.13, High:40.4, Low:39.65, Close:39.95},
{Date:"1-Aug", Open:39.00, High:39.50, Low:38.7, Close:38.6},
{Date:"2-Aug", Open:38.68, High:39.34, Low:37.75, Close:38.84},
{Date:"3-Aug", Open:38.76, High:38.76, Low:38.03, Close:38.12},
{Date:"4-Aug", Open:37.98, High:37.98, Low:36.56, Close:36.69},
{Date:"5-Aug", Open:36.61, High:37, Low:36.48, Close:36.86}
]);
[Bindable]
private var _graphAC:ArrayCollection = new ArrayCollection([
{Graph:"AreaChart", ID:1},
{Graph:"BarChart", ID:2},
{Graph:"ColumnChart", ID:3},
{Graph:"CandlestickChart", ID:4},
{Graph:"HLOCChart", ID:5},
{Graph:"BubbleChart", ID:6},
{Graph:"LineChart", ID:7},
{Graph:"PieChart", ID:8},
{Graph:"PlotChart", ID:9}
]);
// init
private function init():void{
dispGraph(1);
}
// グラフ表示
// no:グラフNo
// 1:AreaChart、2:BarChart、3:ColumnChart
// 4:CandlestickChart、5:HLOCChart、6:BubbleChart
// 7:LineChart、8:PieChart、9:PlotChart
private function dispGraph(no:int):void{
switch (no){
case 1:
AreachartPanel.visible = true;
BarchartPanel.visible = false;
ColumnchartPanel.visible = false;
CandlestickchartPanel.visible = false;
HLOCchartPanel.visible = false;
BubblechartPanel.visible = false;
LinechartPanel.visible = false;
PiechartPanel.visible = false;
PlotchartPanel.visible = false;
break;
case 2:
AreachartPanel.visible = false;
BarchartPanel.visible = true;
ColumnchartPanel.visible = false;
CandlestickchartPanel.visible = false;
HLOCchartPanel.visible = false;
BubblechartPanel.visible = false;
LinechartPanel.visible = false;
PiechartPanel.visible = false;
PlotchartPanel.visible = false;
break;
case 3:
AreachartPanel.visible = false;
BarchartPanel.visible = false;
ColumnchartPanel.visible = true;
CandlestickchartPanel.visible = false;
HLOCchartPanel.visible = false;
BubblechartPanel.visible = false;
LinechartPanel.visible = false;
PiechartPanel.visible = false;
PlotchartPanel.visible = false;
break;
case 4:
AreachartPanel.visible = false;
BarchartPanel.visible = false;
ColumnchartPanel.visible = false;
CandlestickchartPanel.visible = true;
HLOCchartPanel.visible = false;
BubblechartPanel.visible = false;
LinechartPanel.visible = false;
PiechartPanel.visible = false;
PlotchartPanel.visible = false;
break;
case 5:
AreachartPanel.visible = false;
BarchartPanel.visible = false;
ColumnchartPanel.visible = false;
CandlestickchartPanel.visible = false;
HLOCchartPanel.visible = true;
BubblechartPanel.visible = false;
LinechartPanel.visible = false;
PiechartPanel.visible = false;
PlotchartPanel.visible = false;
break;
case 6:
AreachartPanel.visible = false;
BarchartPanel.visible = false;
ColumnchartPanel.visible = false;
CandlestickchartPanel.visible = false;
HLOCchartPanel.visible = false;
BubblechartPanel.visible = true;
LinechartPanel.visible = false;
PiechartPanel.visible = false;
PlotchartPanel.visible = false;
break;
case 7:
AreachartPanel.visible = false;
BarchartPanel.visible = false;
ColumnchartPanel.visible = false;
CandlestickchartPanel.visible = false;
HLOCchartPanel.visible = false;
BubblechartPanel.visible = false;
LinechartPanel.visible = true;
PiechartPanel.visible = false;
PlotchartPanel.visible = false;
break;
case 8:
AreachartPanel.visible = false;
BarchartPanel.visible = false;
ColumnchartPanel.visible = false;
CandlestickchartPanel.visible = false;
HLOCchartPanel.visible = false;
BubblechartPanel.visible = false;
LinechartPanel.visible = false;
PiechartPanel.visible = true;
PlotchartPanel.visible = false;
break;
case 9:
AreachartPanel.visible = false;
BarchartPanel.visible = false;
ColumnchartPanel.visible = false;
CandlestickchartPanel.visible = false;
HLOCchartPanel.visible = false;
BubblechartPanel.visible = false;
LinechartPanel.visible = false;
PiechartPanel.visible = false;
PlotchartPanel.visible = true;
break;
}
}
// DropDownListのデータ変更
private function changeDropDownList(event:Event):void{
dispGraph(Dropdownlist.selectedItem.ID);
}
]]>
</fx:Script>
<s:Group x="0" y="30">
<!-- エリアチャート -->
<s:Panel id="AreachartPanel" title="AreaChart Control" width="450" height="450">
<s:layout>
<s:HorizontalLayout/>
</s:layout>
<mx:AreaChart id="Areachart" height="100%" showDataTips="true" dataProvider="{_dataAC}" width="350">
<mx:horizontalAxis>
<mx:CategoryAxis categoryField="Country"/>
</mx:horizontalAxis>
<mx:series>
<mx:AreaSeries yField="Gold" displayName="Gold"/>
<mx:AreaSeries yField="Silver" displayName="Silver"/>
<mx:AreaSeries yField="Bronze" displayName="Bronze"/>
</mx:series>
</mx:AreaChart>
<mx:Legend dataProvider="{Areachart}"/>
</s:Panel>
<!-- バーチャート(水平方向の棒グラフ) -->
<s:Panel id="BarchartPanel" title="BarChart Control" width="450" height="450">
<s:layout>
<s:HorizontalLayout/>
</s:layout>
<mx:BarChart id="Barchart" height="100%" showDataTips="true" dataProvider="{_dataAC}" width="350">
<mx:verticalAxis>
<mx:CategoryAxis categoryField="Country"/>
</mx:verticalAxis>
<mx:series>
<mx:BarSeries xField="Gold" yField="Country" displayName="Gold"/>
<mx:BarSeries xField="Silver" yField="Country" displayName="Silver"/>
<mx:BarSeries xField="Bronze" yField="Country" displayName="Bronze"/>
</mx:series>
</mx:BarChart>
<mx:Legend dataProvider="{Barchart}"/>
</s:Panel>
<!-- コラムチャート(垂直方向の棒グラフ) -->
<s:Panel id="ColumnchartPanel" title="ColumnChart Control" width="450" height="450">
<s:layout>
<s:HorizontalLayout/>
</s:layout>
<mx:ColumnChart id="Columnchart" height="100%" showDataTips="true" dataProvider="{_dataAC}" width="350">
<mx:horizontalAxis>
<mx:CategoryAxis categoryField="Country"/>
</mx:horizontalAxis>
<mx:series>
<mx:ColumnSeries xField="Country" yField="Gold" displayName="Gold"/>
<mx:ColumnSeries xField="Country" yField="Silver" displayName="Silver"/>
<mx:ColumnSeries xField="Country" yField="Bronze" displayName="Bronze"/>
</mx:series>
</mx:ColumnChart>
<mx:Legend dataProvider="{Columnchart}"/>
</s:Panel>
<!-- キャンドルスティックチャート -->
<s:Panel id="CandlestickchartPanel" title="CandlestickChart Control" width="450" height="450">
<mx:CandlestickChart id="Candlestickchart" height="100%" showDataTips="true" dataProvider="{_data2AC}">
<mx:verticalAxis>
<mx:LinearAxis baseAtZero="false" />
</mx:verticalAxis>
<mx:horizontalAxis>
<mx:CategoryAxis categoryField="Date"/>
</mx:horizontalAxis>
<mx:series>
<mx:CandlestickSeries openField="Open" highField="High" lowField="Low" closeField="Close"/>
</mx:series>
</mx:CandlestickChart>
</s:Panel>
<!-- HLOCチャート -->
<s:Panel id="HLOCchartPanel" title="HLOCchart Control" width="450" height="450">
<mx:HLOCChart id="HLOCchart" height="100%" showDataTips="true" dataProvider="{_data2AC}">
<mx:verticalAxis>
<mx:LinearAxis baseAtZero="false" />
</mx:verticalAxis>
<mx:horizontalAxis>
<mx:CategoryAxis categoryField="Date"/>
</mx:horizontalAxis>
<mx:series>
<mx:HLOCSeries openField="Open" highField="High" lowField="Low" closeField="Close"/>
</mx:series>
</mx:HLOCChart>
</s:Panel>
<!-- バブルチャート -->
<s:Panel id="BubblechartPanel" title="BubbleChart Control" width="450" height="450">
<s:layout>
<s:HorizontalLayout/>
</s:layout>
<mx:BubbleChart id="Bubblechart" height="100%" showDataTips="true" dataProvider="{_dataAC}">
<mx:series>
<mx:BubbleSeries xField="Gold" yField="Silver" radiusField="Bronze"/>
</mx:series>
</mx:BubbleChart>
</s:Panel>
<!-- ラインチャート(折れ線グラフ) -->
<s:Panel id="LinechartPanel" title="LineChart Control" width="450" height="450">
<s:layout>
<s:HorizontalLayout/>
</s:layout>
<mx:LineChart id="Linechart" height="100%" showDataTips="true" dataProvider="{_dataAC}" width="350">
<mx:horizontalAxis>
<mx:CategoryAxis categoryField="Country"/>
</mx:horizontalAxis>
<mx:series>
<mx:LineSeries yField="Gold" displayName="Gold"/>
<mx:LineSeries yField="Silver" displayName="Silver"/>
<mx:LineSeries yField="Bronze" displayName="Bronze"/>
</mx:series>
</mx:LineChart>
<mx:Legend dataProvider="{Linechart}"/>
</s:Panel>
<!-- パイチャート(円グラフ) -->
<s:Panel id="PiechartPanel" title="PieChart Control" width="450" height="450">
<s:layout>
<s:HorizontalLayout/>
</s:layout>
<mx:PieChart id="Piechart" height="100%" showDataTips="true" dataProvider="{_dataAC}" width="350">
<mx:series>
<mx:PieSeries field="Gold" labelPosition="callout" nameField="Country"/>
</mx:series>
</mx:PieChart>
<mx:Legend dataProvider="{Piechart}"/>
</s:Panel>
<!-- プロットチャート -->
<s:Panel id="PlotchartPanel" title="PlotChart Control" width="450" height="450">
<s:layout>
<s:HorizontalLayout/>
</s:layout>
<mx:PlotChart id="Plotchart" height="100%" showDataTips="true" dataProvider="{_dataAC}" width="350">
<mx:series>
<mx:PlotSeries xField="Gold" yField="Silver" displayName="Gold / Silver"/>
<mx:PlotSeries xField="Silver" yField="Bronze" displayName="Silver / Bronze"/>
<mx:PlotSeries xField="Bronze" yField="Gold" displayName="Bronze / Gold"/>
</mx:series>
</mx:PlotChart>
<mx:Legend dataProvider="{Plotchart}"/>
</s:Panel>
</s:Group>
<s:DropDownList id="Dropdownlist" x="0" y="0" width="150" dataProvider="{this._graphAC}" labelField="Graph" prompt="Select Graph" change="changeDropDownList(event)"/>
</s:Application>